アプリオンは、世界のアプリランキングや口コミから、おすすめアプリをまとめている人気アプリ探しサイトです。

Renko Charts Lite [iPhone]

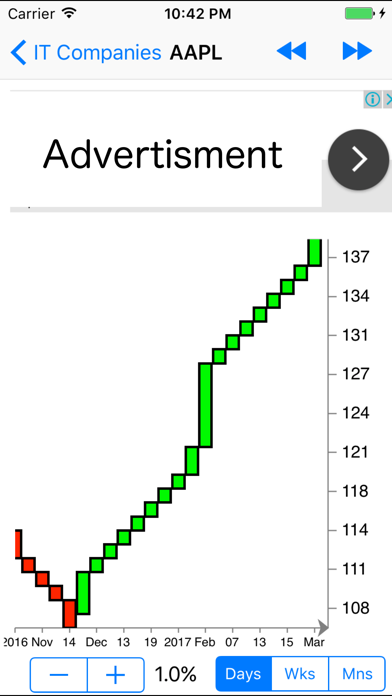
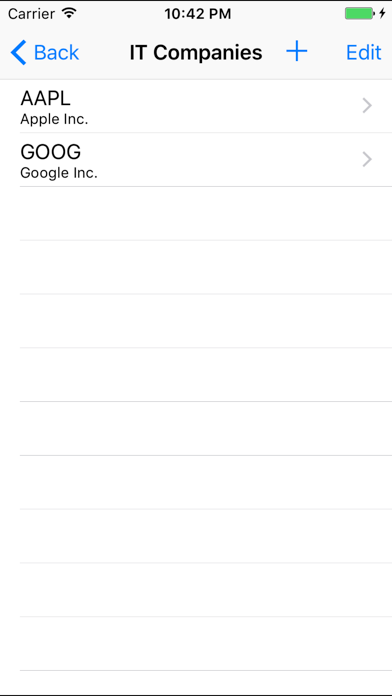
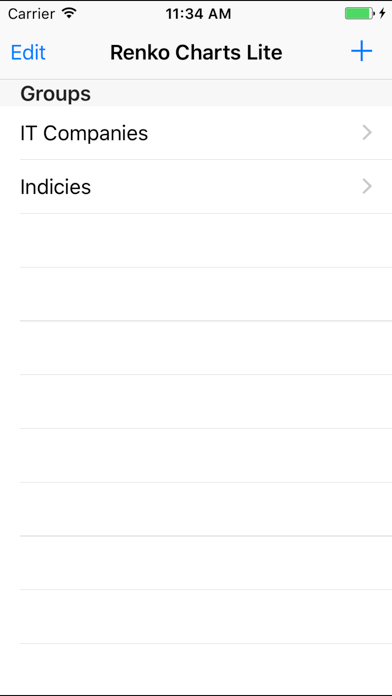
IGOR VLASOVが配信するiPhoneアプリ「Renko Charts Lite」の評価や口コミやランキング推移情報です。このアプリには「ファイナンス」「ビジネス」などのジャンルで分類しています。APPLIONでは「Renko Charts Lite」の他にもあなたにおすすめのアプリのレビューやみんなの評価や世界ランキングなどから探すことができます。

現在、このアプリは非公開になっている可能性があります (探す)
Renko Charts Liteのおすすめ画像1
Renko Charts Liteのおすすめ画像2
Renko Charts Liteのおすすめ画像3
<
>

IGOR VLASOVのファイナンスアプリ

「Renko Charts Lite」は、IGOR VLASOVが配信するファイナンスアプリです。

ファイナンス ビジネス

このアプリの話題とニュース

  • 新バージョン1.2.2が配信開始。新機能や改善アップデートがされています。


  • 2012年10月11日(木)にiPhoneとiPad両対応のユニバーサルアプリとしてリリース!


最新更新情報

version1.2.2が、2021年12月5日(日)にリリース

YahooFinance symbols autosuggest module is dead. It replaced with custom one.

使い方や遊び方

The only Renko charting app on the store! It uses YahooFinance data feed as a source. So if a stock is listed in YahooFinance, you can quickly and easily see its daily, weekly, or monthly Renko chart.
Renko charts are price charts with rising and falling diagonal lines of boxes that are either filled or hollow. Renko charts are "time independent" charts that do not have constantly spaced time axes.
The word "Renko" comes from "Renga", the Japanese word for "brick". The filled and hollow squares that make up a Renko chart are often referred to as "bricks." Renko charts were popularized by Steve Nison in his book Beyond Candlesticks.
Renko charts have a pre-determined "Brick Size" that is used to determine when new bricks are added to the chart. If prices move more than the Brick Size above the top (or below the bottom) of the last brick on the chart, a new brick is added in the next chart column. Hollow bricks are added if prices are rising. Black bricks are added if prices are falling. Only one type of brick can be added per time period. Bricks are always with their corners touching and no more than one brick may occupy each chart column.
It's important to note that prices may exceed the top (or bottom) of the current brick. Again, new bricks are only added when prices completely "fill" the brick. For example, for a 5-point chart, if prices rise from 98 to 102, the hollow brick that goes from 95 to 100 is added to the chart BUT the hollow brick that goes from 100 to 105 is NOT DRAWN. The Renko chart will give the impression that prices stopped at 100.
It's also important to remember that Renko charts may not change for several time periods. Prices have to rise or fall "significantly" in order for bricks to be added.
Green bricks are bullish, Red bricks are bearish - that's the simplest interpretation of Renko charts. Renko charts may be most useful in identifying trends and trend direction. Because they screen out moves that are less than the brick size, trends are much easier to spot and follow. In order to avoid whiplash periods, some people wait until 2 or 3 bricks appear in a new direction before taking a position.
In the app size of the brick is defined by close price percentage.

最新ストアランキングと月間ランキング推移

Renko Charts LiteのiPhoneアプリランキングや、利用者のリアルな声や国内や海外のSNSやインターネットでの人気状況を分析しています。

基本情報

仕様・スペック

対応OS
8.0 以降
容量
6.0 M
推奨年齢
全年齢
アプリ内課金
なし
更新日
2021/12/05

リリース日
2012/10/11

集客動向・アクティブユーザー分析

オーガニック流入

アクティブ率

※この結果はRenko Charts Liteのユーザー解析データに基づいています。

ネット話題指数

開発会社の配信タイトル

このアプリと同一カテゴリのランキング

ジブリの食卓 天空の城ラピュタ
スタジオジブリ
amazon

IGOR VLASOV のアプリ

IGOR VLASOV の配信アプリ >

新着おすすめアプリ

新着おすすめアプリ >

注目まとめ

iPhoneアプリまとめ >