アプリオンは、世界のアプリランキングや口コミから、おすすめアプリをまとめている人気アプリ探しサイトです。

Stock Market Sector Indexes [iPhone]

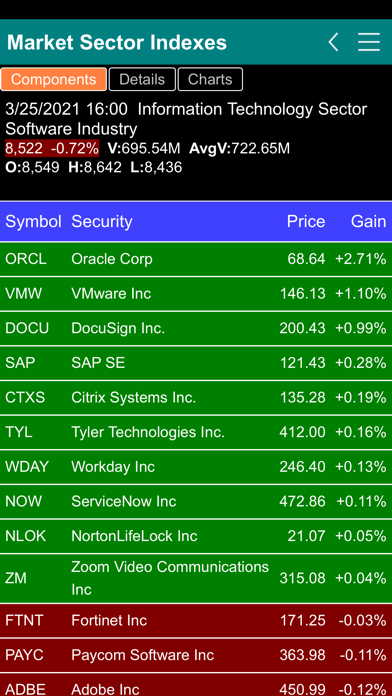
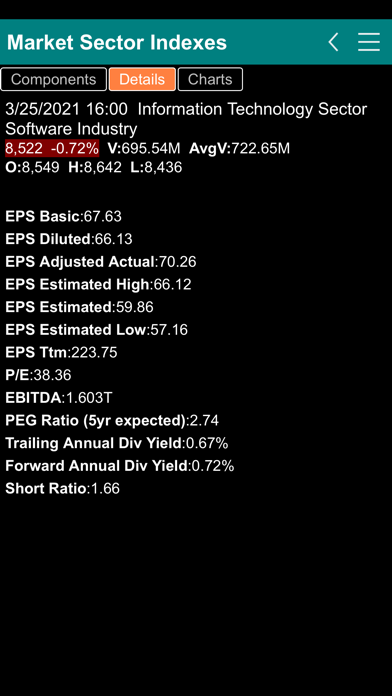
George Kungが配信するiPhoneアプリ「Stock Market Sector Indexes」の評価や口コミやランキング推移情報です。このアプリには「ファイナンス」「辞書/辞典/その他」などのジャンルで分類しています。APPLIONでは「Stock Market Sector Indexes」の他にもあなたにおすすめのアプリのレビューやみんなの評価や世界ランキングなどから探すことができます。

Stock Market Sector Indexesのおすすめ画像1
Stock Market Sector Indexesのおすすめ画像2
Stock Market Sector Indexesのおすすめ画像3
Stock Market Sector Indexesのおすすめ画像4
Stock Market Sector Indexesのおすすめ画像5
Stock Market Sector Indexesのおすすめ画像6
Stock Market Sector Indexesのおすすめ画像7
Stock Market Sector Indexesのおすすめ画像8
<
>

George Kungのファイナンスアプリ

「Stock Market Sector Indexes」は、George Kungが配信するファイナンスアプリです。

ファイナンス 辞書/辞典/その他

このアプリの話題とニュース

  • 新バージョン2.0が配信開始。新機能や改善アップデートがされています。


  • 2020年12月29日(火)にiPhoneとiPad両対応のユニバーサルアプリとしてリリース!


最新更新情報

version2.0が、2021年3月26日(金)にリリース

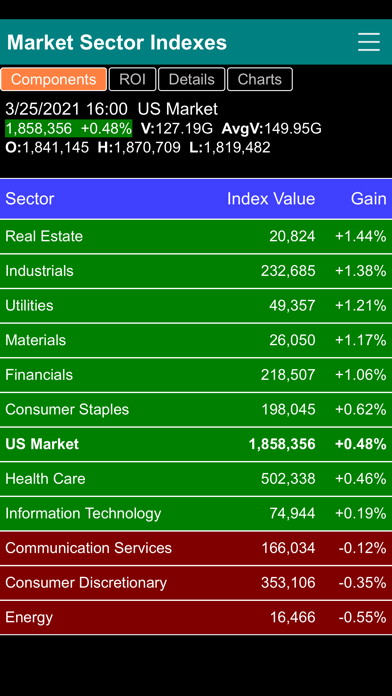
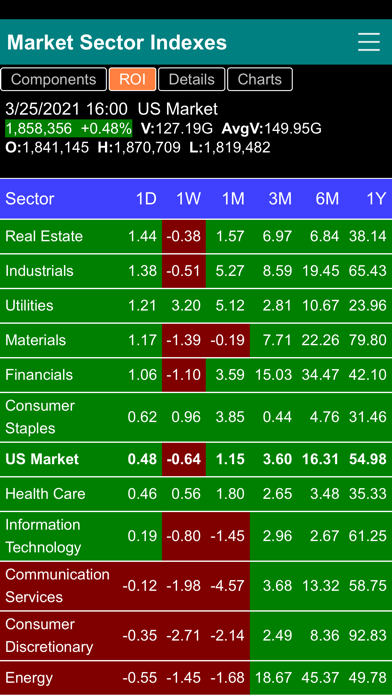
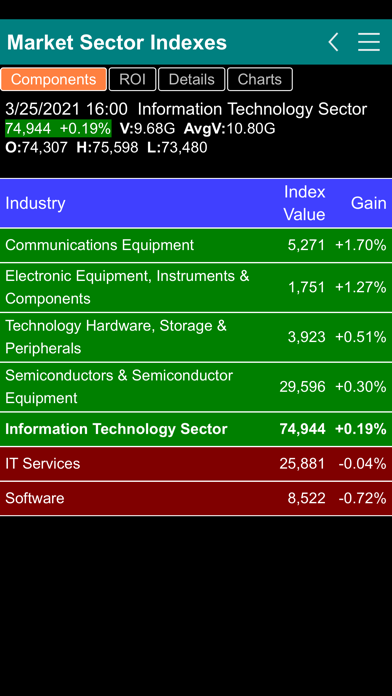
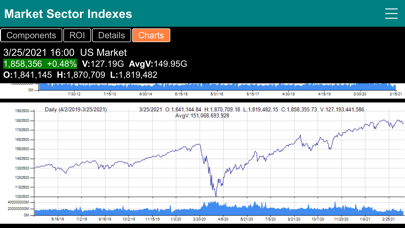
Intraday indexes calculated from real time market data.
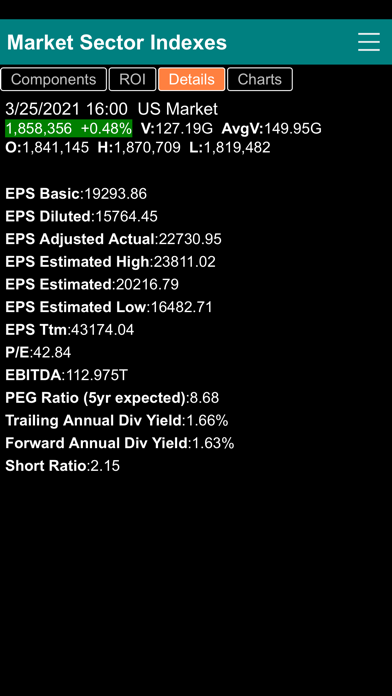
New data matrixes for all the indexes including EPS, P/E, short ratio … and much more.
New platform supporting additional matrixes to be added in the future without the need to update the app.

使い方や遊び方

The US Market Indexes publication from Bull Laboratories (BullLabs.com) is a collection of stock market composite indexes that includes more than six hundreds public trading companies and ADRs with the largest market capitalizations on the NYSE, NASDAQ, AMEX stock exchanges and the OTCBB (Over-The-Counter Bulletin Board). The group of indexes currently contains 634 stocks from 11 sectors categorized into 69 industries, with the composition weight of each component adjusted periodically based on its market capitalization.


In additional to standard pricing and volume data, other financial data and numbers for each sector and industry are also derived and calculated based on the numbers and allocations of its underlying components. For example, the EPS (earning per share) an industry is obtained by summing up the EPS numbers of each component multiplied by number of shares in the holding. This allows investors to benchmark the performance of investment based on specific stock market sectors or industries.


Intraday index pricing and volume data are calculated based on real time market data. Other financial data and characteristics are derived on a daily basis after market close. Subscribed users have access to up-to-date and detailed index data as well as unlimited download of historic numbers and charts.

This app includes four types of information for each sector or industry index. The Components screen gives a list of underlying components of the index with prices and gains/losses. The Performance screen shows the list of components of the index with performance data from daily, weekly, monthly, 3-month, 6-month and one year periods. The Details screen gives specific information of each index, including the trading volume, the 52-week average volume, the allocation percentage of the industry within the sector, earning per share (ttm EPS) of the index and the Price to Earning (ttm P/E) of the index. The Graph screen gives the monthly, weekly and daily price chart of the index.


Sector and Industry specific indexes allow investors to benchmark the performance of investment based on specific stock market sectors or industries. Just as all stocks tend to move based on the underlying factors that drive the overall market, stocks in a similar industry tend to move based on underlying factors that affect the industry. One of the most basic methods for understanding the risk of an investment portfolio is to determine its sector breakdown. Is the portfolio spread across different industrial sectors or is it concentrated in just a few? This provides a good indication of how an investment portfolio will respond to macroeconomic factors or industry trends.


Market sector and industry indexes are also essential tools for the Sector Rotation Investment Strategy. A rotation strategy is very similar in approach to tactical asset allocation, but rather than asset classes, the investor will allocate his funds to specific sectors or industries depending on the short-term view. The investor will overweight the sectors or industries that he or she believes will outperform and underweight those expected to underperform.

最新ストアランキングと月間ランキング推移

Stock Market Sector IndexesのiPhoneアプリランキングや、利用者のリアルな声や国内や海外のSNSやインターネットでの人気状況を分析しています。

基本情報

仕様・スペック

対応OS
11.0 以降
容量
1.3 M
推奨年齢
全年齢
アプリ内課金
なし
更新日
2021/03/26

リリース日
2020/12/29

集客動向・アクティブユーザー分析

オーガニック流入


アクティブ率


※この結果はStock Market Sector Indexesのユーザー解析データに基づいています。

利用者の属性・世代

アプリ解析デモグラフィックデータ(男女年代比率52%)

やばいよ、やばいよ~~

デモグラフィックデータを元にユーザー層の性別や年齢分布などを考慮して推定しています。

ネット話題指数

開発会社の配信タイトル

このアプリと同一カテゴリのランキング

街とその不確かな壁
村上 春樹
amazon

George Kung のアプリ

George Kung の配信アプリ >

新着おすすめアプリ

新着おすすめアプリ >

注目まとめ

iPhoneアプリまとめ >