アプリオンは、世界のアプリランキングや口コミから、おすすめアプリをまとめている人気アプリ探しサイトです。

S&P 500 Stock Map [iPhone]

George Kungが配信するiPhoneアプリ「S&P 500 Stock Map」の評価や口コミやランキング推移情報です。このアプリには「ファイナンス」「辞書/辞典/その他」などのジャンルで分類しています。APPLIONでは「S&P 500 Stock Map」の他にもあなたにおすすめのアプリのレビューやみんなの評価や世界ランキングなどから探すことができます。

S&P 500 Stock Mapのおすすめ画像1
S&P 500 Stock Mapのおすすめ画像2
S&P 500 Stock Mapのおすすめ画像3
S&P 500 Stock Mapのおすすめ画像4
S&P 500 Stock Mapのおすすめ画像5
S&P 500 Stock Mapのおすすめ画像6
S&P 500 Stock Mapのおすすめ画像7
S&P 500 Stock Mapのおすすめ画像8
S&P 500 Stock Mapのおすすめ画像9
S&P 500 Stock Mapのおすすめ画像10
<
>

George Kungのファイナンスアプリ

「S&P 500 Stock Map」は、George Kungが配信するファイナンスアプリです。

ファイナンス 辞書/辞典/その他

このアプリの話題とニュース

  • 新バージョン4.0.0が配信開始。新機能や改善アップデートがされています。


  • 2020年12月1日(火)にiPhoneとiPad両対応のユニバーサルアプリとしてリリース!


最新更新情報

version4.0.0が、2022年12月12日(月)にリリース

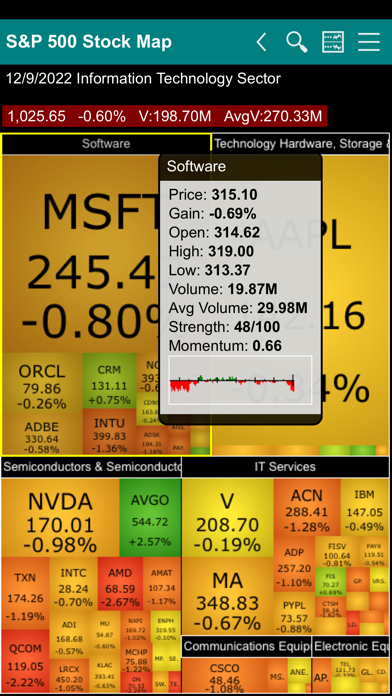
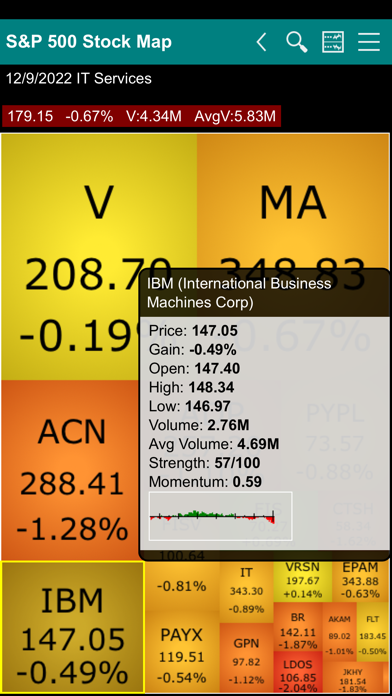
.Third-level map shows stocks under one specific industry, allowing small blocks to be visible on small screens.
.Search function finds stocks based on stock symbols or company names.
.Watch list displays custom list of stocks.

使い方や遊び方

.S&P500 Stock Market Heat Map
.Intraday Market Data update every minute when stock market opens
.Three levels of map: Entire index, Sector, and Industry maps
.Performance (Gain), Volume, Average Volume and Index values on Sectors, Industries as well as individual stocks.
."Strength" measures strength of the price movement of a stock compared to others using real time data.
."Momentum" measures trading volume of a stock compared to its own average volume using real time data. Intraday volume strength compares average volume normalized to portion of time elapsed in the session.
.Intraday price chart for all components - stocks, industries, sectors and entire index.
.Colorful representation of gain and loss of indexes and stocks.
.Block sizes represent Market Capitalization of components.
.11 Sectors and 65 Industries.
.S&P 500 compositions and allocations.
.Company fundamental data including market cap, earnings, dividend, short ratio ... and much more.
.Watch list displays custom list of stocks.
.Search for stock by symbol and name.


Stock Market Map is a visual representation of stock market data. This specific map categorizes S&P 500 stocks into sectors and industries. The top-level map consists of sectors of the entire market and all the industries under each specific sector. The second-level map starts with a specific sector and consists of all the industries and then all the individual company’s stock under each industry. It is an investment research tool let you quickly view the performance of different sectors, industries and individual companies. The size of the block in the map represents the values of the component (stock or industry) within the portfolio of its parent (industry or sector). The color of the block represents the daily price movement of the component. The overall performance of the entire stock market and/or individual sector can be easily grasped by a glimpse to the map by the color and size of the blocks.


Tapping a block brings up a popup box showing the name, real time price, price gain, volume and the 13 week average volume, relative pricing strength , volume momentum and pricing chart (version 3 new feature) of the sector, industry or individual stock. The name of each component is labeled on top of each block. Double tapping any block from the top-level map navigates to the second-level map of the sector that the block belongs. Tap the back button on the title bar or the back button on the mobile device to navigate back to the top-level map.


The S&P 500 Stock Map tracks stocks using the same compositions and allocations of stocks in the S&P 500 index. The prices, volumes, average volumes and other information of sectors and industries are calculated similarly by BullLabs.com. Indexes are calculated based on the market capitalization of underlying stocks or industries in the level. Sector and Industry specific indexes allow investors to benchmark the performance of investment based on specific stock market sectors or industries. Just as all stocks tend to move based on the underlying factors that drive the overall market, stocks in a similar industry tend to move based on underlying factors that affect the industry. One of the most basic methods for understanding the risk of an investment portfolio is to determine its sector breakdown. Is the portfolio spread across different industrial sectors or is it concentrated in just a few? This provides a good indication of how an investment portfolio will respond to macroeconomic factors or industry trends.


Company fundamental data include Market capitalization, outstanding shares, EBITDA, PEG Ratio, Dividend per share, forward and trailing dividend rate and yield, dividend payout date, ex div date, P/E, trailing and forward PE, price/sales, short ratio, book value, price/book, price target, current and forward EPS, EPS report date, EPS ttm, Basic EPA, Diluted EPS, High/Low EPS estimation, number of analysts.

カスタマーレビュー・評価

3.0
5つ星
 
0
4つ星
 
1
3つ星
 
0
2つ星
 
1
1つ星
 
0

最新ストアランキングと月間ランキング推移

S&P 500 Stock MapのiPhoneアプリランキングや、利用者のリアルな声や国内や海外のSNSやインターネットでの人気状況を分析しています。

基本情報

仕様・スペック

対応OS
11.0 以降
容量
3.1 M
推奨年齢
全年齢
アプリ内課金
あり
更新日
2022/12/12

リリース日
2020/12/01

集客動向・アクティブユーザー分析

オーガニック流入


アクティブ率


※この結果はS&P 500 Stock Mapのユーザー解析データに基づいています。

アプリ内課金の売れ筋ランキング

  • 1位: S&P 500 Stock Map Registration (4500円)

利用者の属性・世代

アプリ解析デモグラフィックデータ(男女年代比率52%)

Yes、We Can!

デモグラフィックデータを元にユーザー層の性別や年齢分布などを考慮して推定しています。

ネット話題指数

開発会社の配信タイトル

このアプリと同一カテゴリのランキング

ゆうちゃみ 写真集「ゆうな」
古川優奈
amazon

George Kung のアプリ

George Kung の配信アプリ >

新着おすすめアプリ

新着おすすめアプリ >

注目まとめ

iPhoneアプリまとめ >